SM
Sheby M
Loading portfolio experience
Loading portfolio experience
Finance, Sales · Web App, Dashboard, API
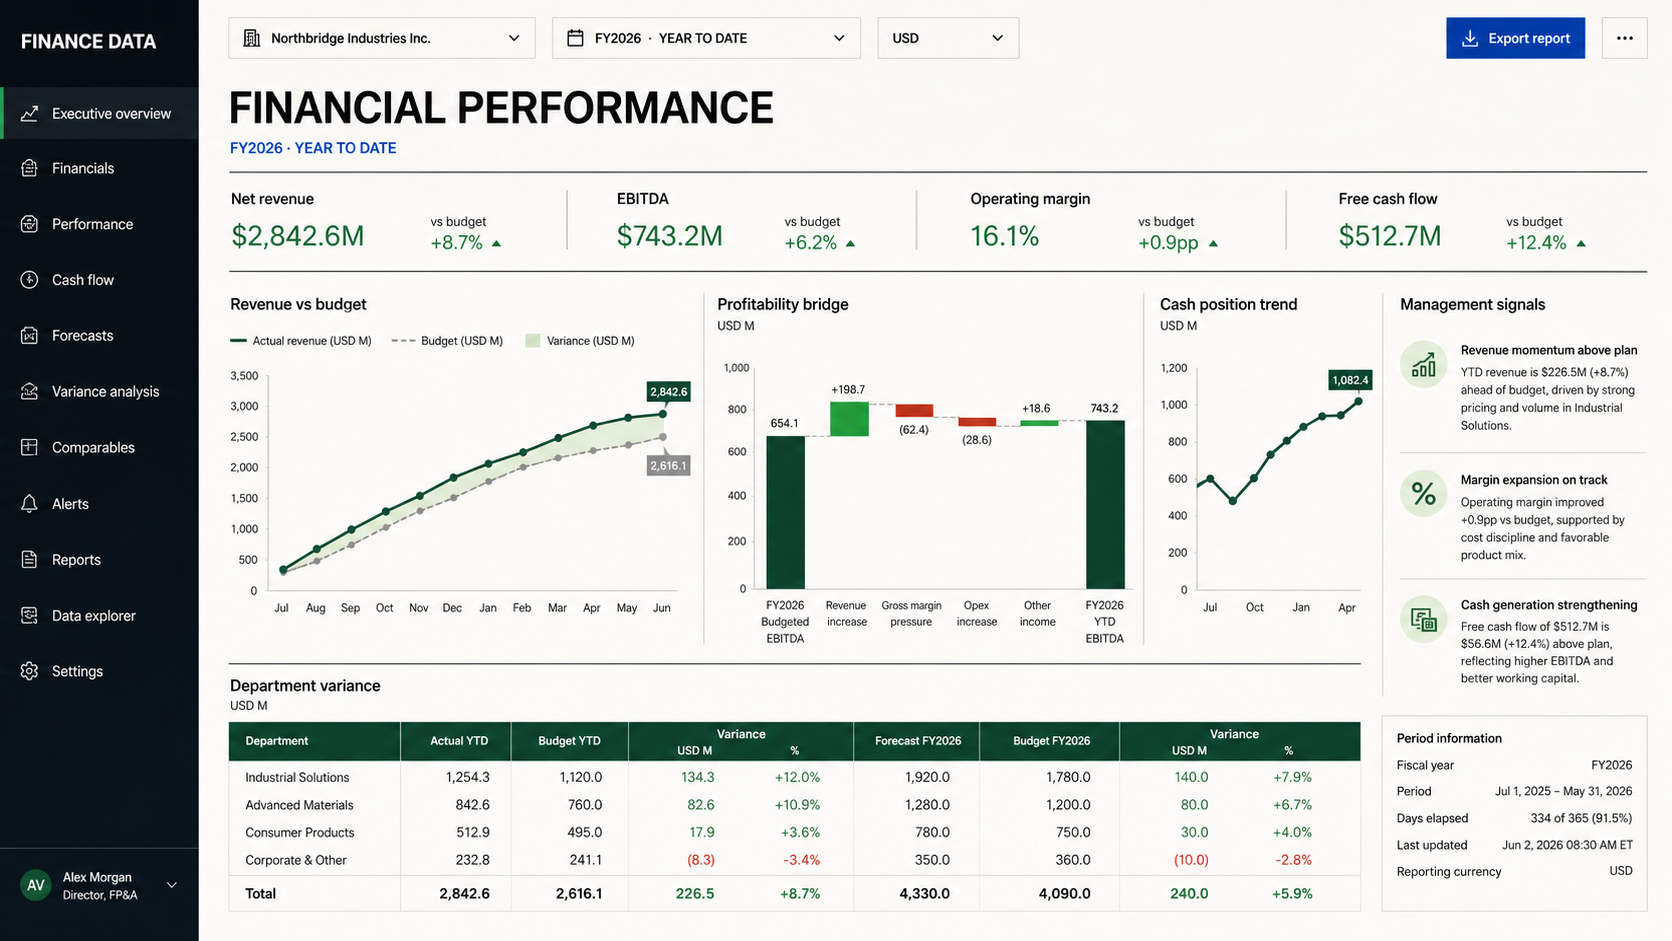
An interactive financial dashboard that converts company statements and operational data into clear KPIs, trends, comparisons, drill-down reports, and decision-ready visualizations.
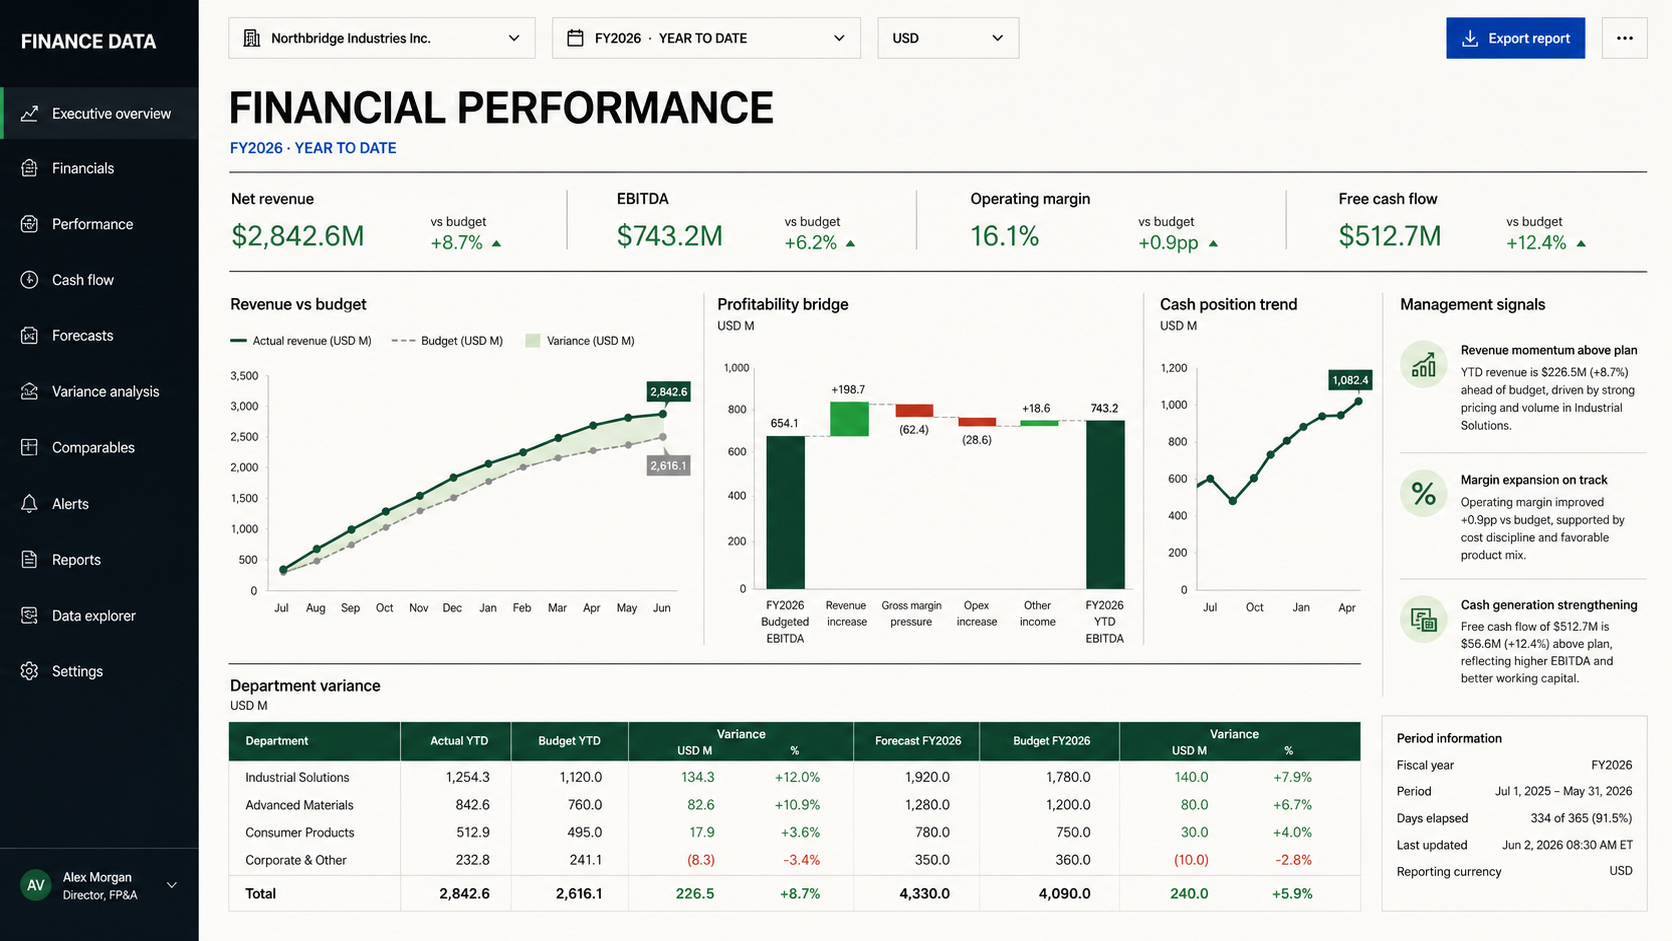
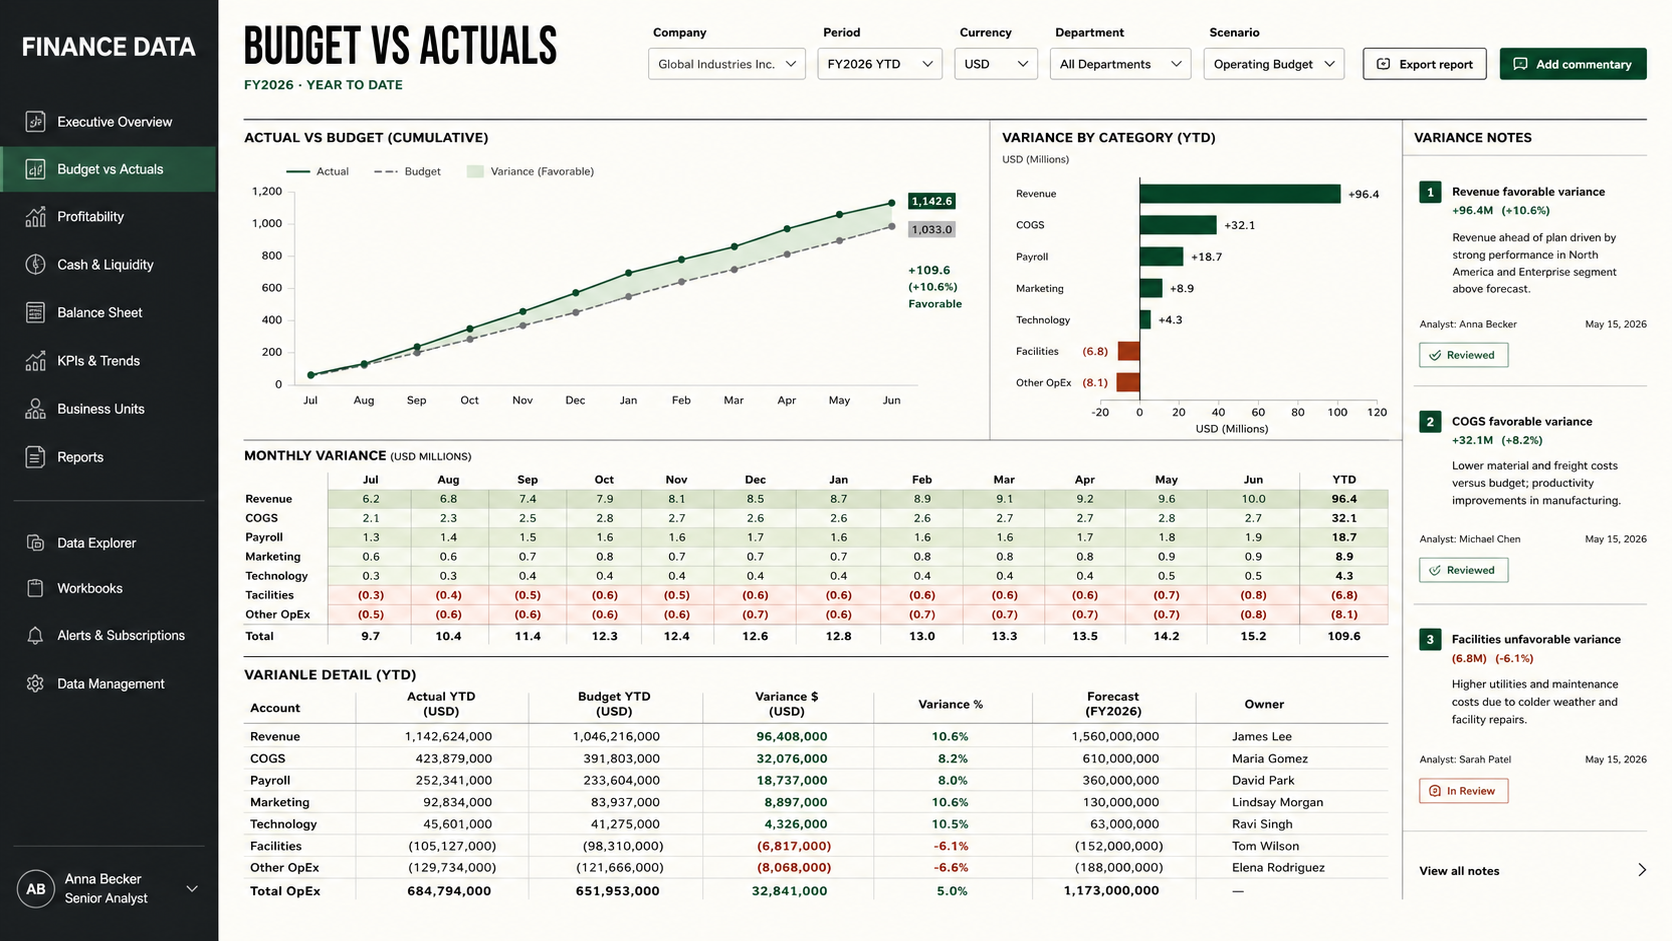
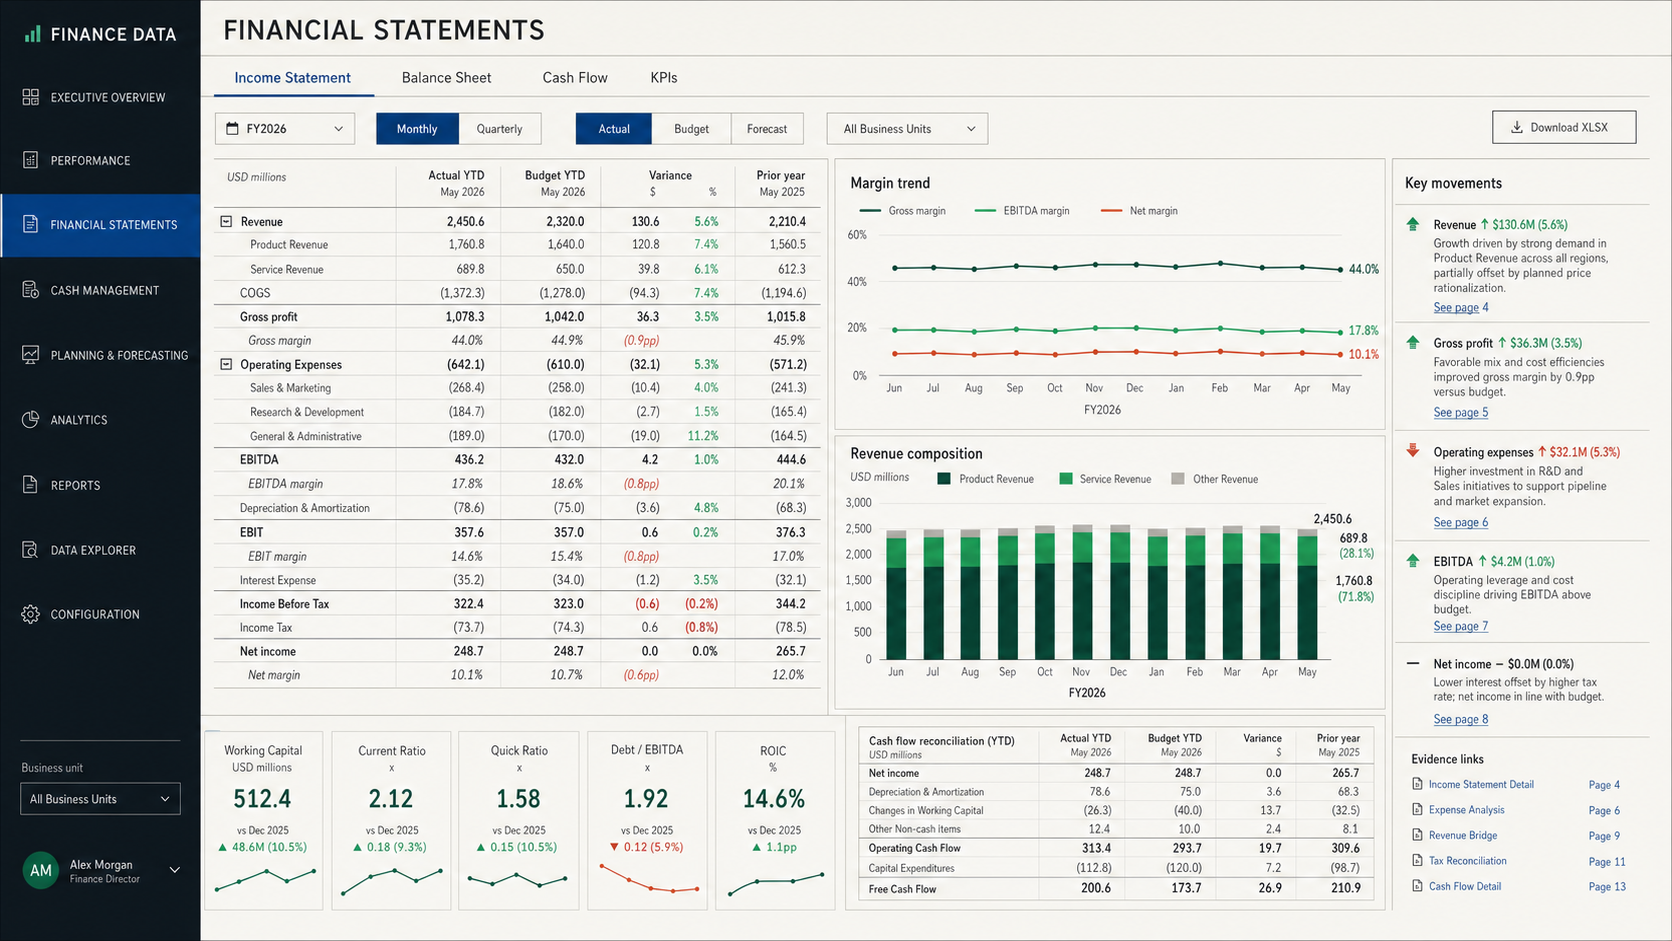
Financial statements and business KPIs were maintained across spreadsheets and accounting exports. Managers needed a faster way to understand revenue, profitability, liquidity, expenses, cash flow, working capital, and performance against targets without manually rebuilding reports every period.
I developed FinSight as an interactive data visualization dashboard connected to company financial statements and operational sources. The platform imports profit and loss statements, balance sheets, cash-flow statements, budgets, and KPI data. A Python processing layer validates account mappings and calculates approved financial metrics. Users can filter by company, department, location, product, and reporting period, then drill from summary KPIs into the underlying accounts and transactions.
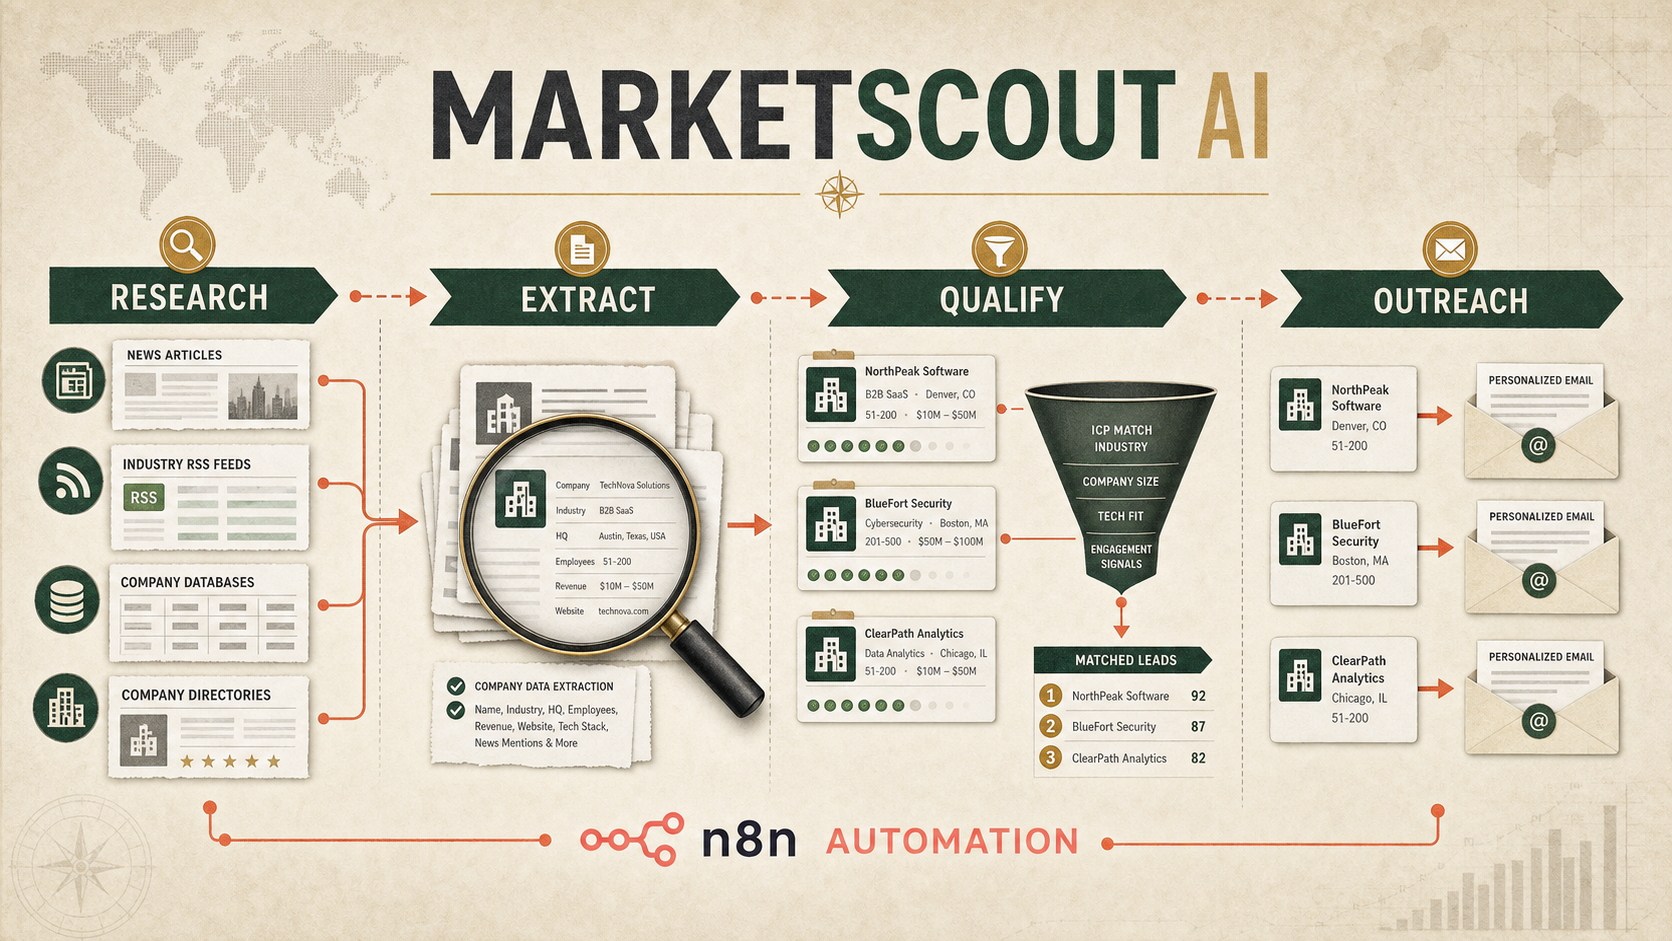
Sales, Finance · AI Agent, Automation, Web App↗
Finance, Sales · Dashboard, Automation, Web App↗
Finance, Sales · AI Agent, Automation, Website↗