SM
Sheby M
Loading portfolio experience
Loading portfolio experience
Finance, Sales · Dashboard, Automation, Web App
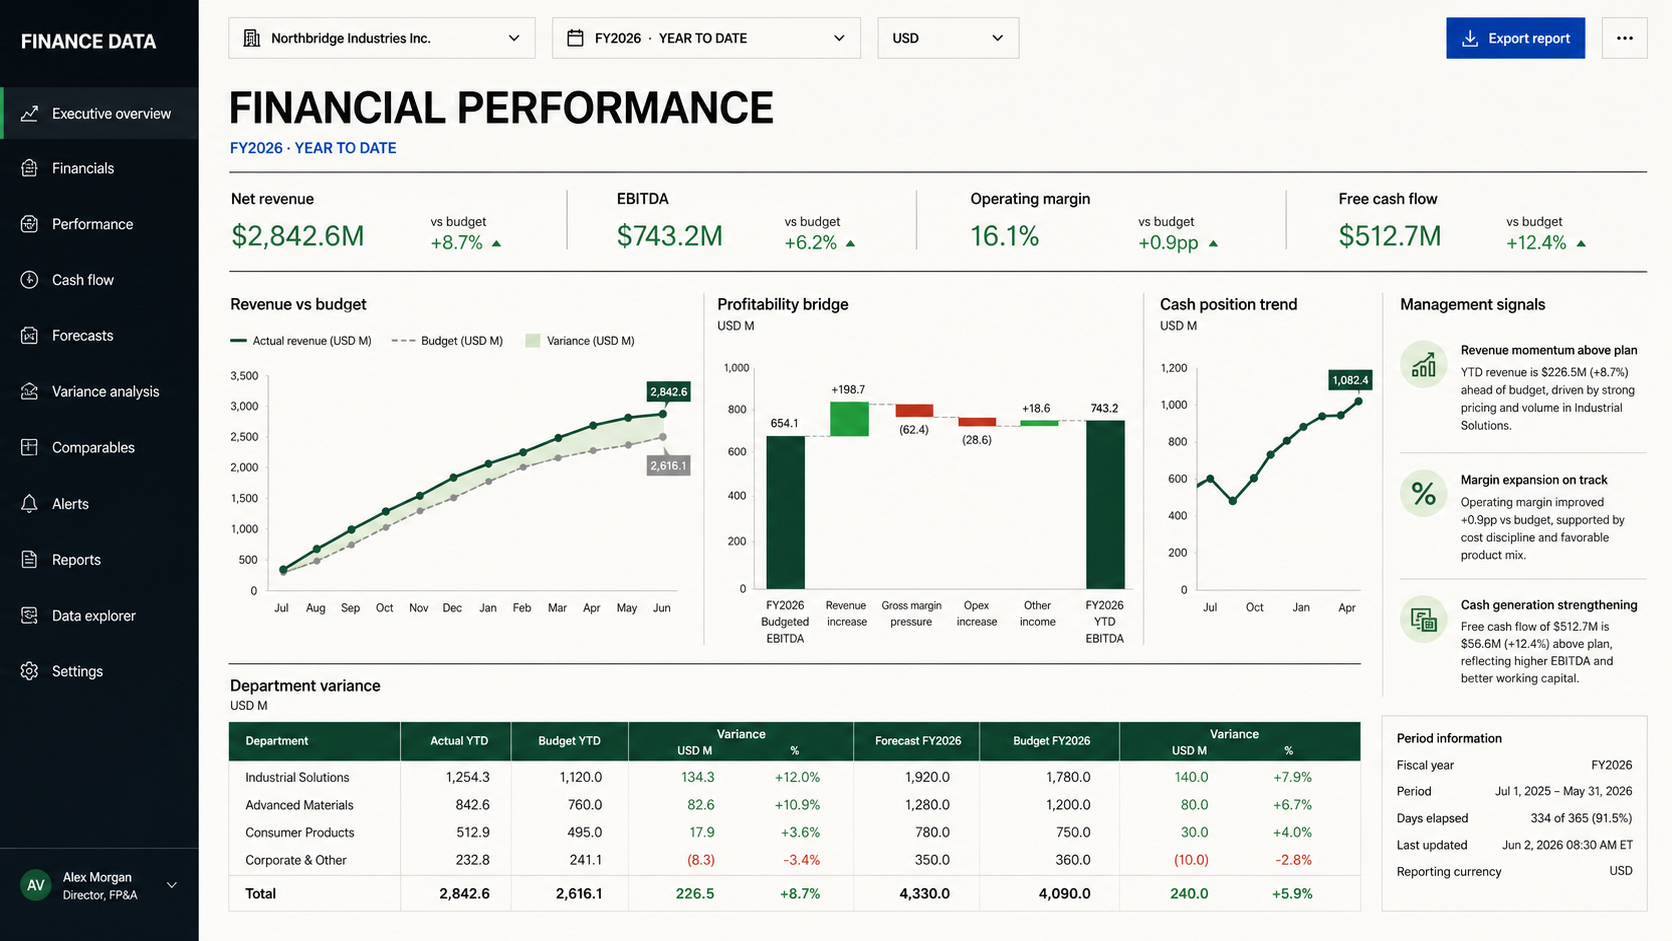
An interactive financial analytics dashboard for exploring KPIs, income statements, balance sheets, cash flow, budgets, and year-over-year performance.
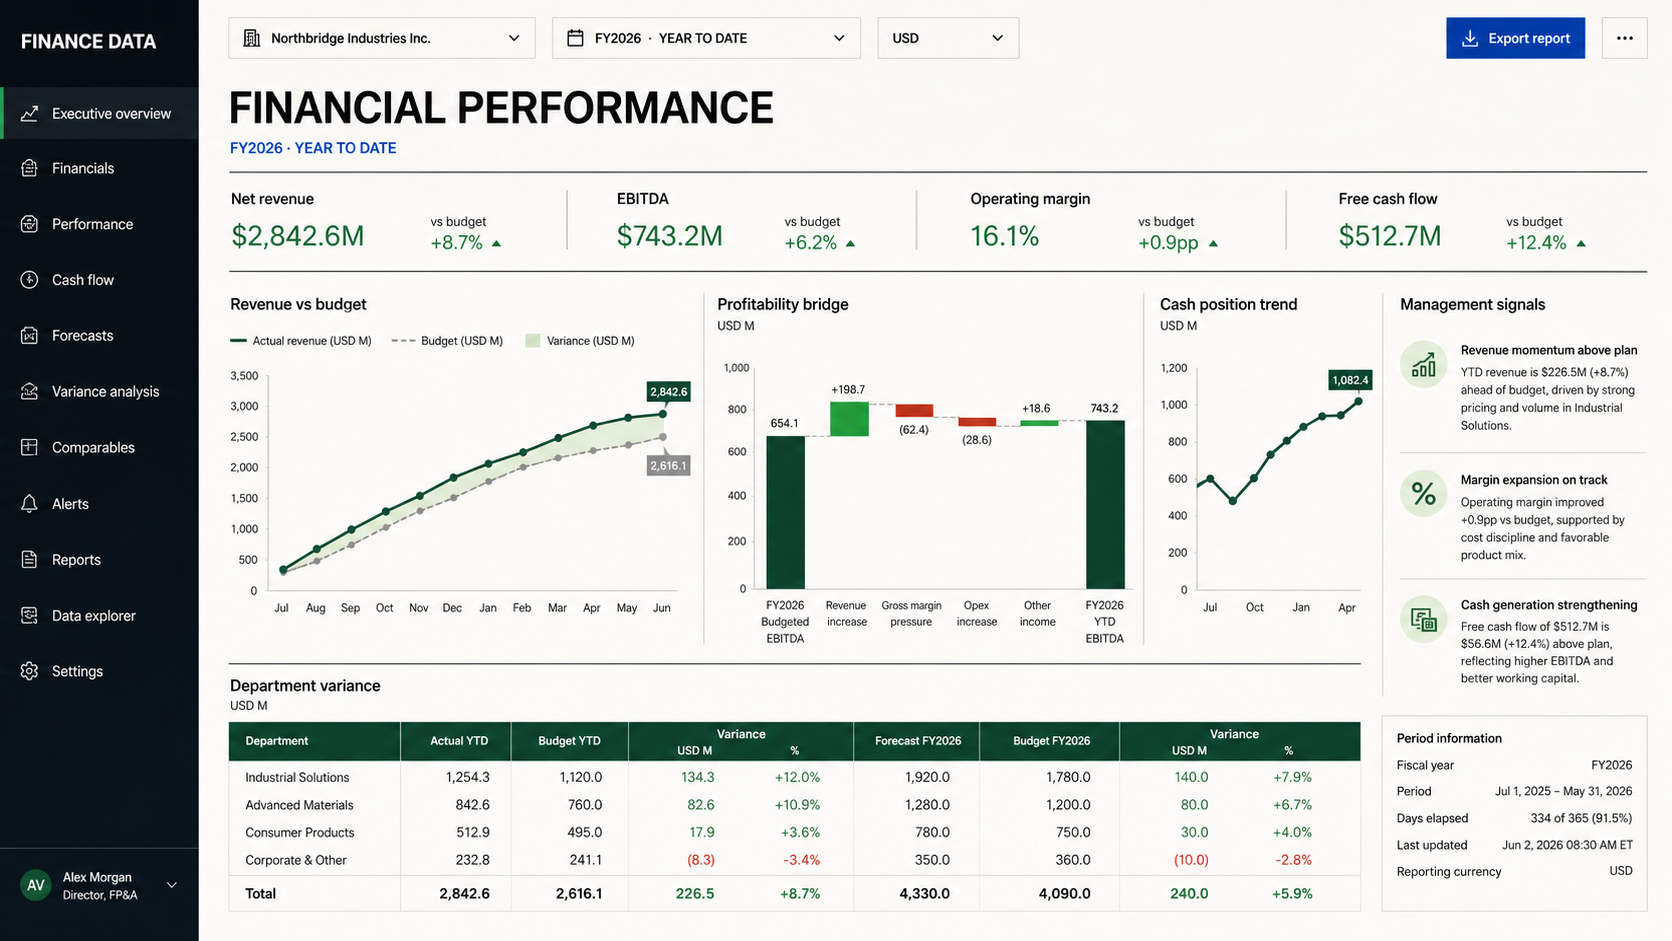
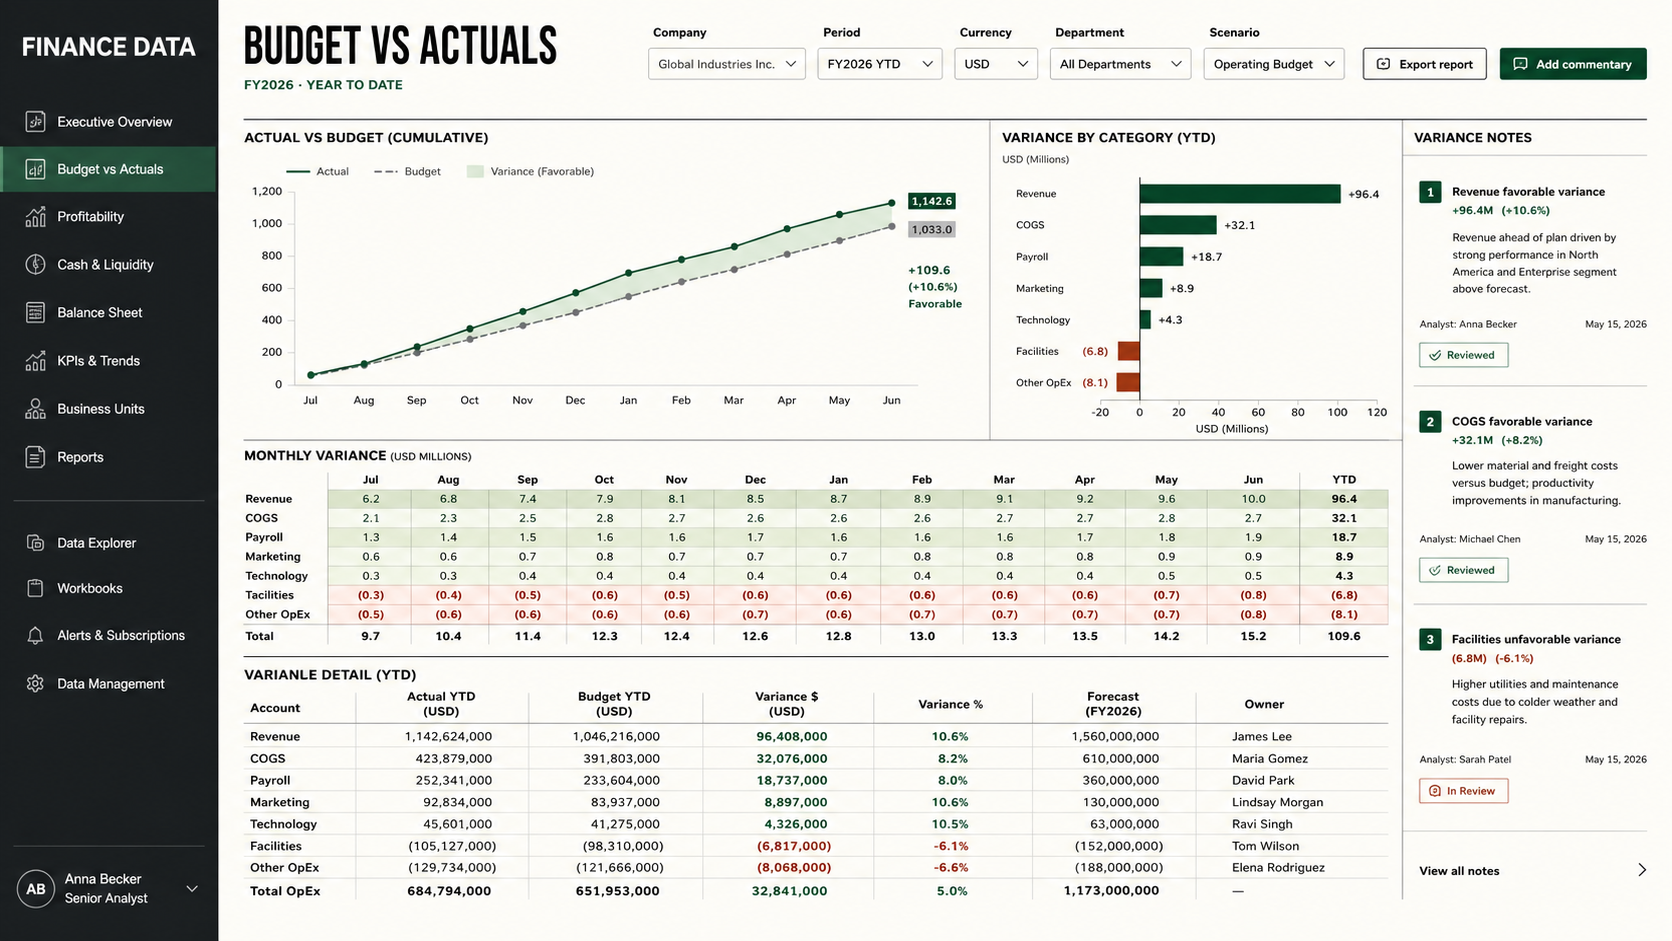
Financial analysts frequently work with financial data distributed across multiple spreadsheets, reporting periods, departments, and statement formats. Comparing budgeted and actual performance, calculating year-over-year changes, and identifying the causes of financial variances requires repetitive data preparation and manual chart creation. This delays reporting and makes it difficult for decision-makers to understand financial performance quickly.
I developed a Python-based financial analytics dashboard that processes structured financial data and converts it into interactive reports. Users can select a reporting period, financial statement, account category, department, or KPI to update the dashboard instantly. The system calculates budget variances, year-over-year changes, margins, liquidity indicators, and cash-flow movements before presenting them through clear charts, tables, and performance summaries.