SM
Sheby M
Loading portfolio experience
Loading portfolio experience
Business Operations, Sales · Dashboard
An interactive Power BI dashboard that helps a bakery manufacturer balance production with demand, analyze product returns, and improve delivery-route planning.
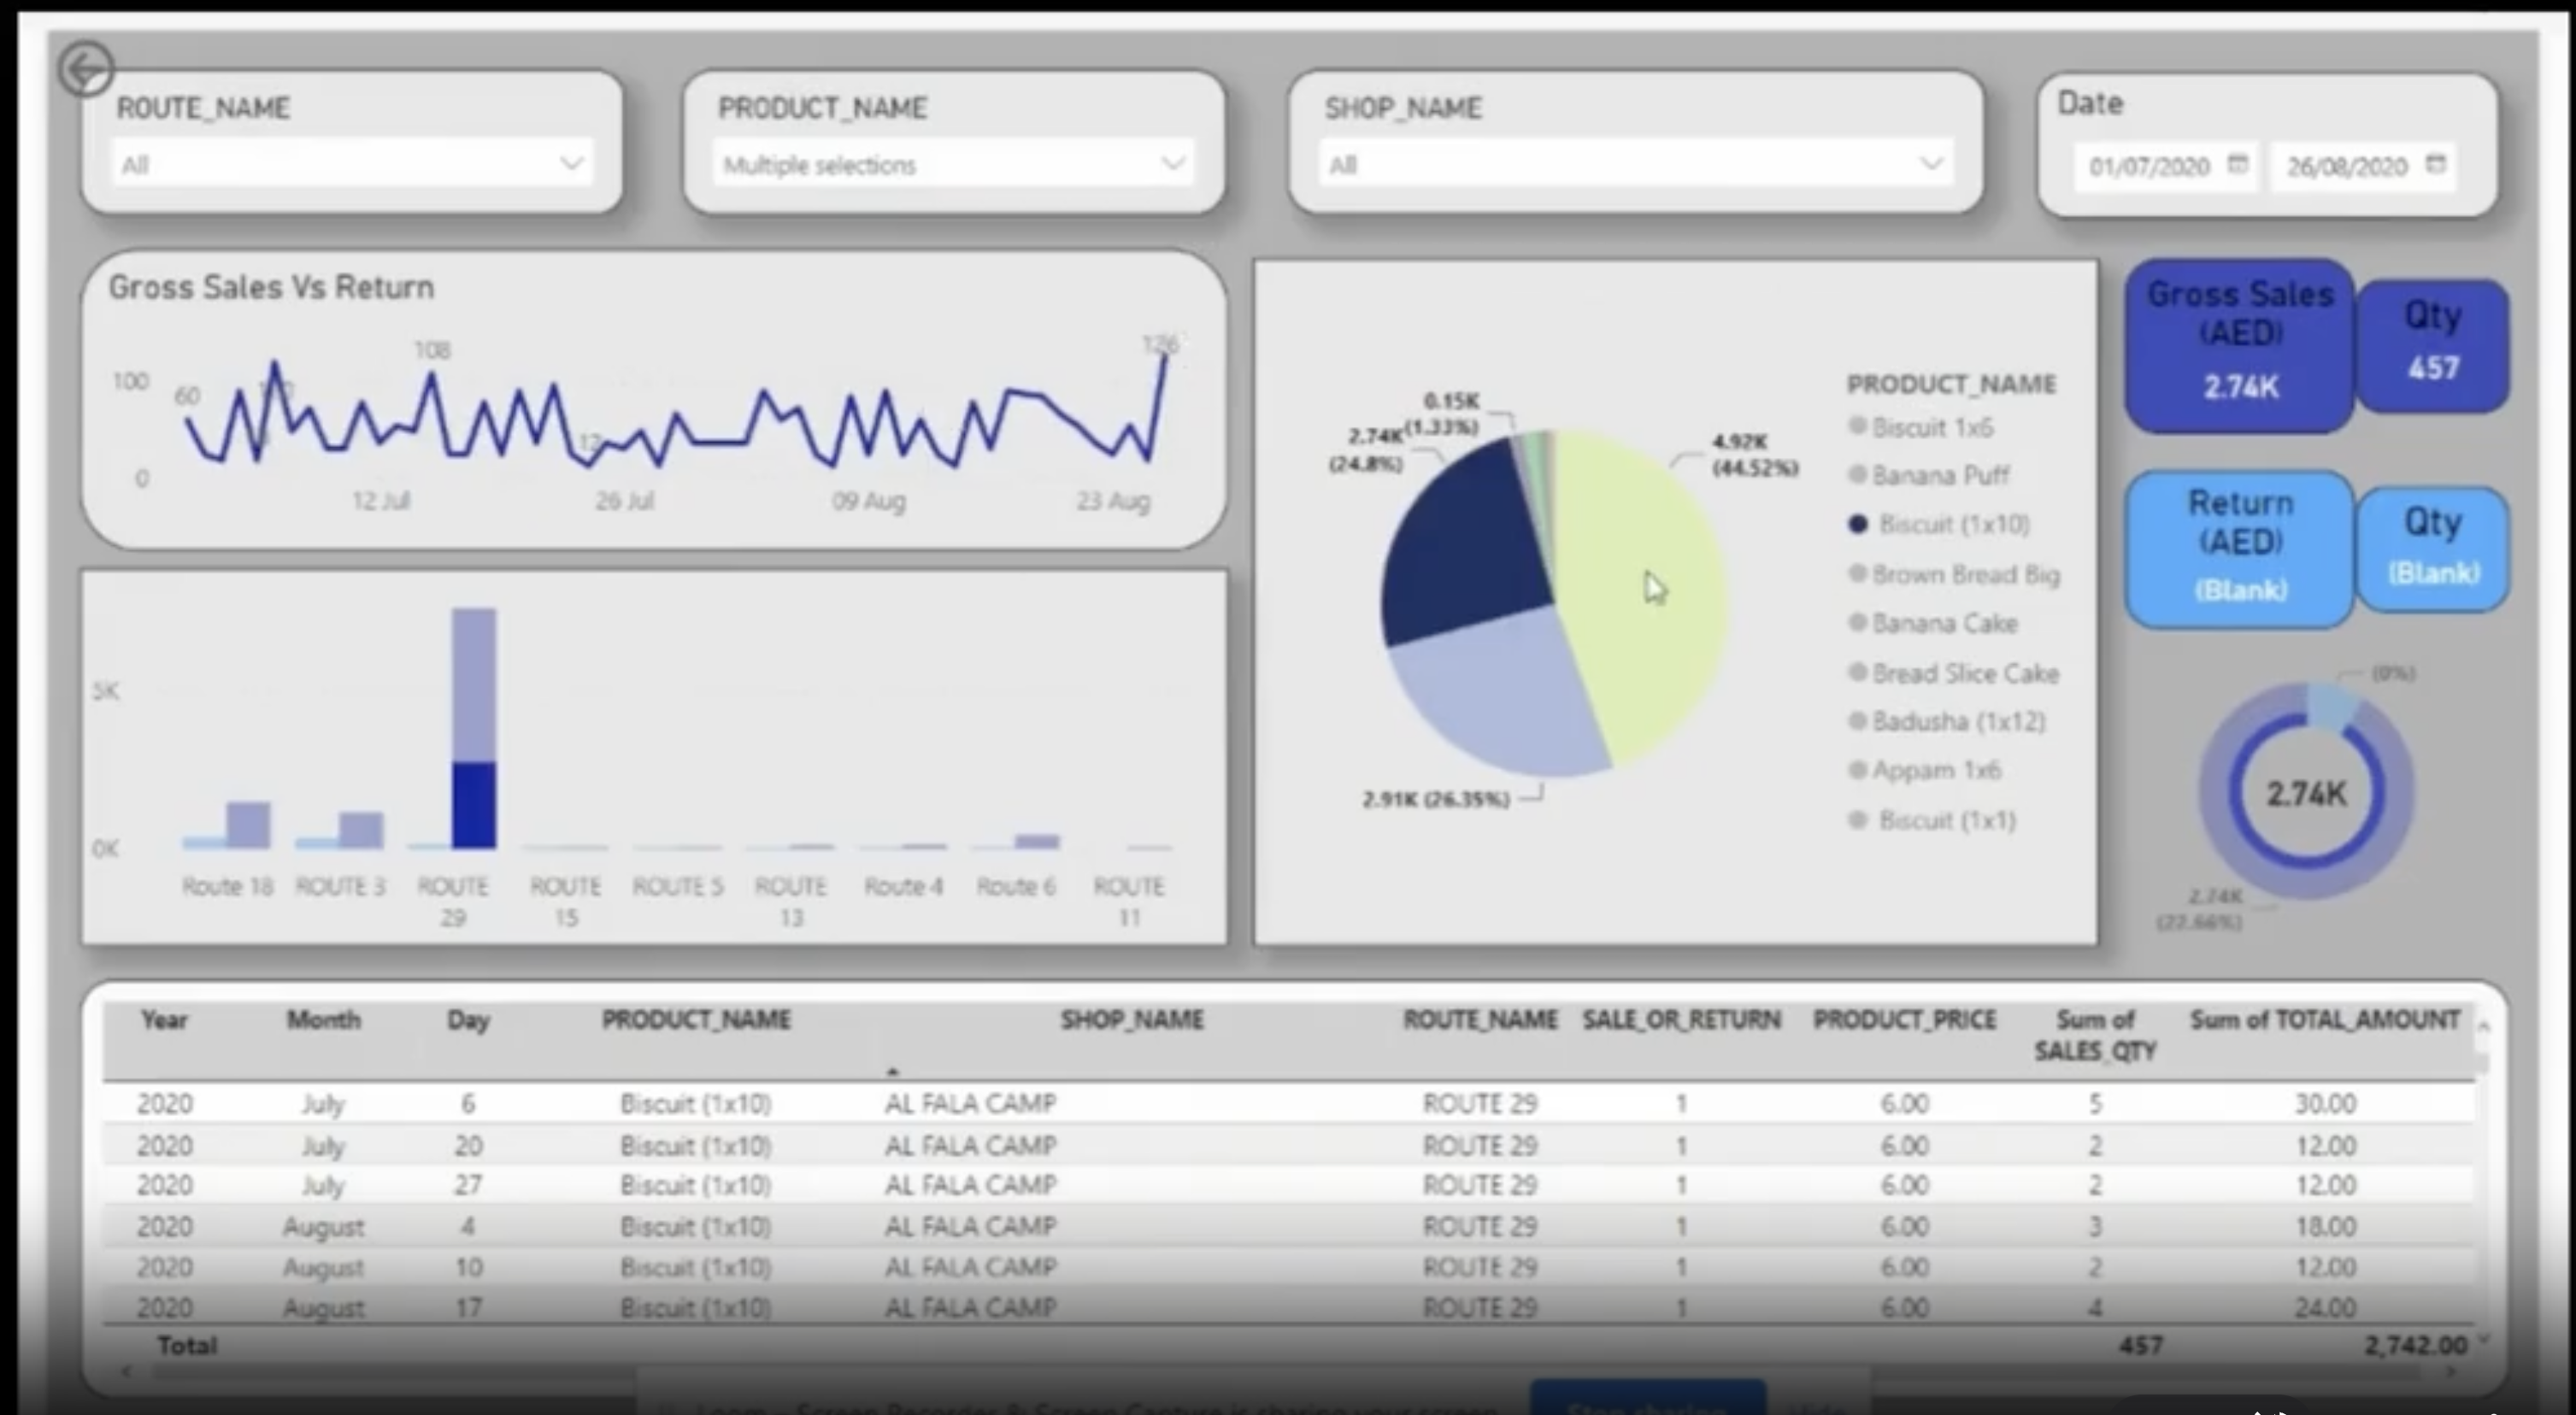
The bakery manufacturer needed to decide daily production quantities while managing changing demand across products and delivery routes. Production, sales, delivery, and return data were difficult to compare, making it hard to understand overproduction, identify recurring returns, and determine which routes required operational improvements.
I created an interactive Power BI dashboard that combines production, sales, delivery, and returned-product data into a structured analytical model. Power Query and Python were used to clean and prepare the source data, while DAX measures calculated production efficiency, return rates, demand variance, product performance, and route-level trends. Managers can filter the dashboard by date, product, category, delivery route, and location to compare planned production with actual demand and identify the products or routes responsible for the highest return volumes.